How to Make the Most of Your Business’ Data
Dustin Hoffman’s character in Rain Man demonstrates his ability to look at a pile of toothpicks and instantly tell you how many there are in the pile.
Can you think on your feet and make informed decisions about your business or are you simply guessing? Are you making important financial calls based on hard facts or just sticking your finger in the air and hoping for the best?
Before Covid-19, the business landscape was extremely crowded. But since we have started to emerge from lockdown, levels of competition have been taken to another level since. With so many businesses fighting for a slice, you can’t afford to be making errors or even educated guesses. If you’re to keep your competitive edge, you have to be driven by detail in all aspects of your business. How, then, do you go about driving your business forward with pinpoint accuracy?
Use your data!
The ability to very quickly ‘see’ what a list of raw data or information is telling you is nigh on impossible! Unless you have a savant-like ability to instantly perform complex calculations and form them into a mental visualisation, you are going to need some help to crunch the data in order to access the information you need.
When using data exported from an application, whether that be an accounting software, a CRM or anything that holds lots of information, you need a powerful application to summarise, drill-down, extrapolate and make sense of all of the individual data points. Microsoft Excel is Your New Best Friend!
Microsoft Excel is Your New Best Friend!
Microsoft Excel allows you to create some illustrative and insightful – some might say beautiful – outputs that can speed up your analysis and expand the way you drive your business decisions. This information can be incredibly powerful in informing your future decisions. It can be the difference between profit and loss; business success and failure.
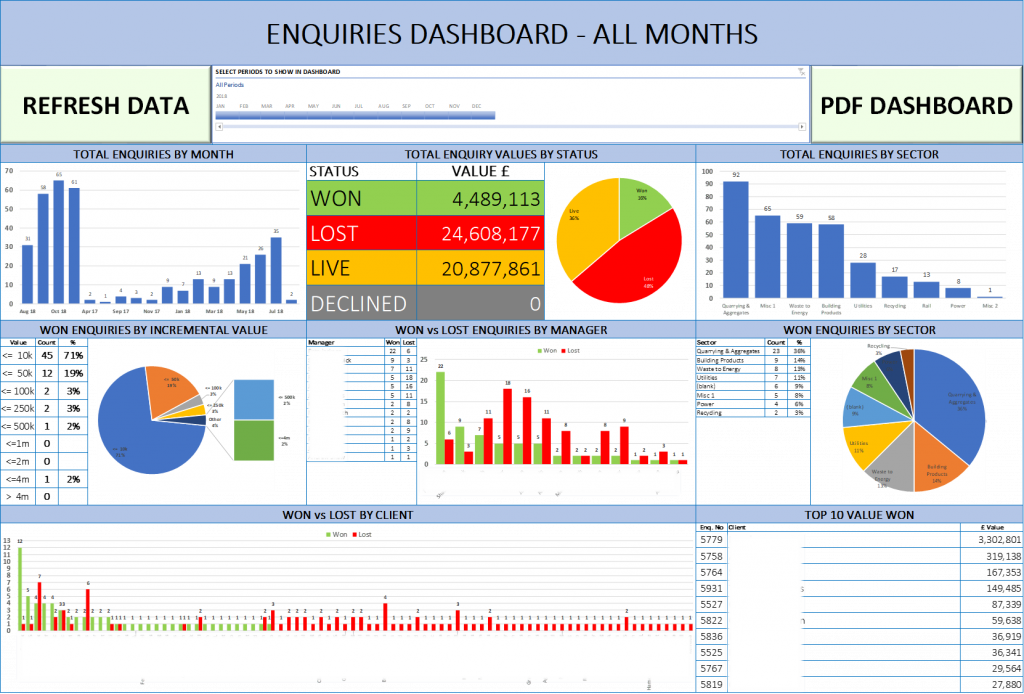
Your Business Dashboard
You can quickly refer to your Microsoft Excel Dashboard to find all of your key metrics in one place!
A Microsoft Excel dashboard can be implemented for any function in a business – Credit Control, Sales, Stock Out etc.
A dashboard does not always have to contain charts; you can ask it to show a summary data table too. The following is an example of an automated Excel based process that loops through a number of individuals to produce their own dashboard, before going on to produce summary dashboards based on a number of geographic levels.
A well-made dashboard is an immensely powerful business tool! Do not waste your time scrolling through row and rows of data or studying metrics individually. Use a Microsoft Excel dashboard to represent your data in a way that will help your leadership team or any decision-makers to come to a consensus quickly. You may not be in the business of toothpicks, but if you’re a Microsoft Office user, the power of Rain Man is at your disposal!